Appointment scheduling is a vital component for any business that derives its revenue from a service, yet, it's all too often overlooked. Other, more glamorous duties, such as sales or revenue collection oftentimes take center stage. While all business processes are important, having an efficient scheduling process can add measurable value to the success of the company. The goal is to be more efficient and more effective. Two ways to establish these goals are to utilize visualization and color in the appointment scheduling process.
WHY VISUALIZATION MATTERS
Take a look at Figure 1: Visualization without color. This is a table list of scheduled appointments. Notice how it is difficult to visualize how these appointments are related to date, times and each other. Where are they in the weekly schedule? Do any appointments conflict with each other?

You could eventually answer the above questions, but not without some serious cognitive load. If you are forced to tune your senses so acutely in order to make sense of what you are seeing you're unlikely to be time efficient. Moreover, a table list like that introduces the likelihood for human error thereby diminishing effectiveness. Mistakes will be made.
I'm not saying there isn't a place for tables and lists. Absolutely not. In fact, for large companies with 100's of appointments in a day, visualization may be impaired without a table list.
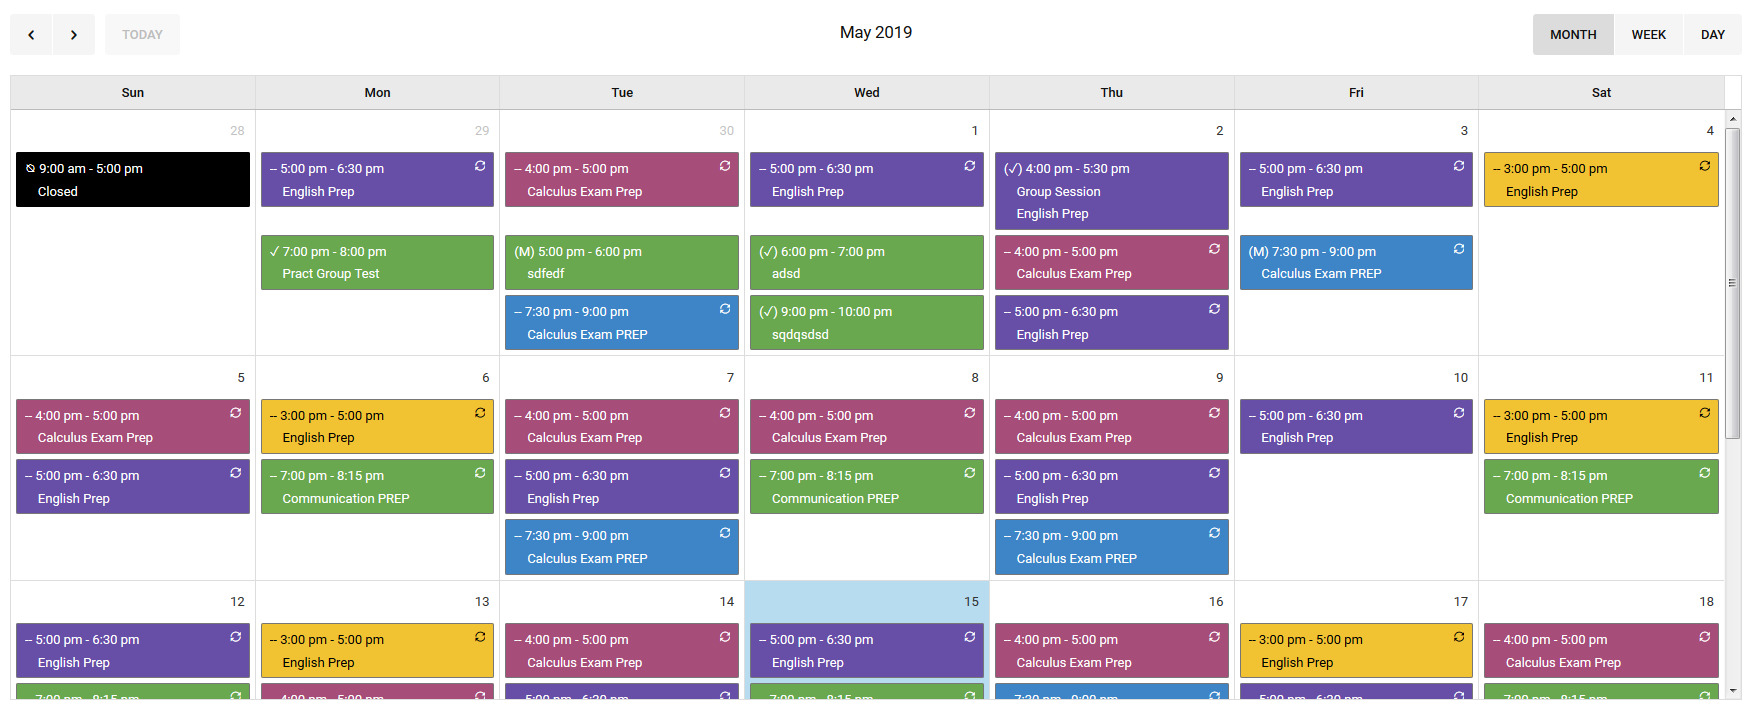
Let's have a look at Figure 2: A colorful monthly appointment schedule. Unlike Figure 1, it is easy to see how appointments are related to each other. Each is displayed according to earliest to latest and color-coded based on practitioner.
What screen would you prefer to look at?
A well laid out visual calendar is easy to look at and allows you to gleam information quickly and effectively. You can easily see there are 4-5 practitioners on the schedule with the bulk of appointments occurring mid-week with some appointments on the weekends. Monday's and Friday's appear to be light on the number of appointments and are prime for new appointments should they be requested.
There is a lot going on in Figure 2, but the use of visualization makes it easy to interpret the information. Figure 1 is clearly a less desirable method for visualizing schedules.
But Figure 2 could become quite cluttered with 10 or more appointments per day?
I agree.
Let's consider Figure 3: A colorful weekly appointment schedule.

That's better. Right?
The monthly view starts looking like a vegetable salad when there are more than a few appointment per day, not that there is anything wrong with vegetable salad.
Once we fine-tune our scope or focus on a specific range of schedules, the clutter goes away and we are back to interpreting the information quickly and easily.
At this point I've highlighted the importance of visualization. Proper use of visualization can make a huge difference in your ability to interpret information but I also want to mention the need for color.
Consider the above examples for good visualization but take away the color. Would it be as effective?
Probably not, right?
COLOR HELPS TO DIFFERENTIATE INFORMATION
The use of color helps in processing information. In our case, color allows us to focus instantly on a specific practitioners appointments, interpret scheduling conflicts, and identify clusters of appointments by days, times, and individuals.
We can further de-clutter by shifting our scope and taking advantage of color more succinctly. Figure 4: Color and availability scheduling depicts a single practitioner's appointments for the week.
Notice the combination of whitespace, colored appointment blocks, and background highlighting. For this practitioner, we can clearly see their schedule across the top header, the day of the week, and their availability for each day.

How easy would it be for you to schedule an appointment for this person?
Very easy?
This clearly outlines the use of visualization and color as they relate to efficiency, but what about effectiveness?
When I use the term, effectiveness, I am referring to the accuracy of human resource deployment.
Hold your horses!
Human resource development is a cryptic phrase for a simple concept. When I use that phrase I am calling attention to an intelligent use of your labor force's time. It would not be effective to schedule one or two of your practitioners for 80% of the appointments. In addition, you don't want to schedule a practitioner for two separate appointments occurring at the same time.
Color has an additional role in scheduling. View Figure 5: Color visualizes availability.

For the Friday session at 5:00 pm to 6:30 pm, notice how the background color is white and not purple. The background color announces the availability of the practitioner. Thus, where the background color is white, the practitioner is not available.
Figure 5 shows a scheduling issue. Unlike Figure 1, here we can instantly see a potential problem. We either need to reschedule or see if the practitioner can make an exception to their availability.
Figure 5 is a perfect example of color and visualization in action. If you are scheduling appointments you need these features to effectively and efficiently deploy your staff while managing the demands of your time.
QUEUING AS A VISUALIZATION TECHNIQUE
Lastly, I want to mention queuing. Queuing is a visualization technique. The visualization and color techniques we have discussed so far are powerful but rely on the user to manipulate and utilize scope.
If the user is viewing the calendar by month or choosing not to filter down to the practitioner level, they may miss a scheduling conflict.
Who's fault is that?
That question is debatable, but what isn't debatable is the effect of a conflict on the business's bottom line.
Scheduling conflicts will cost the business money. Revenue is lost because of the conflict, and could also translate into future loss based on client dissatisfaction.
Now consider Figures 6 and 7. Notice the bell icon at the top-right of the images. In Figure 6 the bell is green, but in Figure 7 the bell is orange. This is an example of visual queuing.


These images are showing us a conflict of participants for Thursday May 16th. Unfortunately, missing this conflict would be easy if we were attempting to manager dozens of appointments on a busy calendar.
Using a visual queue that is prominently positioned at the top of the page, and changing its color when a conflict is present, makes it simple to communicate problems to schedulers.
Next, if clicking on the bell icon takes you to a page of listed appointments in conflict (Figure 8), the use of visualization and color is complete in establishing a highly efficient and effective scheduling system.

Could this benefit you?
CONCLUDING REMARKS
Manipulating and interpreting appointment data properly and in a timely manner is essential to the success of service-based companies. Use visualization and color to save you time, and increase client satisfaction.
The images used within this article come from Bizstim's business management software. It has a visual calendar and session lists that use color and visualization to help you be more efficient and effective when scheduling your clients and practitioners.
You can test out our calendar for free using our 21 day trial. Explore how visualization and color can make your job easier. Thanks for taking the time to read this article. We hope the information can help you to build your business bigger and better.


Do you use calendar software with features that are helpful? Tell us about them.